
How the Prop Firm Score Works
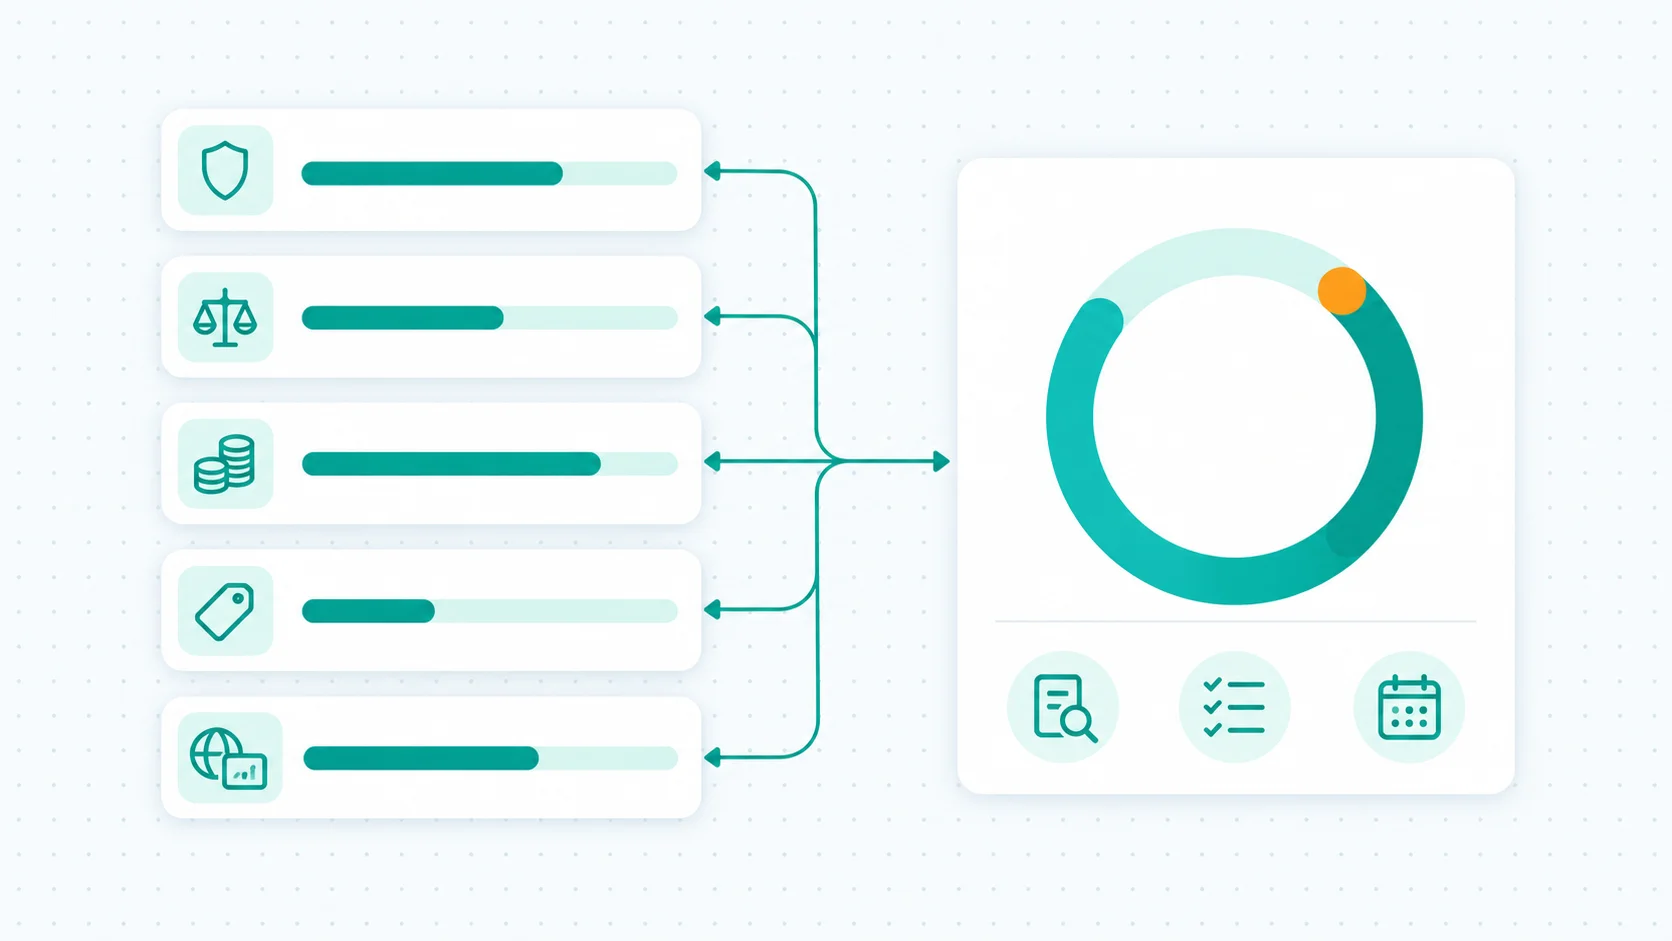
The score rests on five categories: Trust, Rules, Payouts, Costs and Trading Access. Rules, Payouts, Costs and Trading Access contain 40 weighted components. An analyst scores each of those 40 components out of 10 from research guided by a published score guide. Trust is a judgement across six factors weighed together. Fixed arithmetic then applies. Category scores are weighted averages of component scores, shown only when at least 70% of the component weight has usable scores. Programme families are averaged equally; Trust is scored once per firm. A programme family scoring 3/10 or below in Rules or Payouts caps that category at 6/10. The weighted total combines category scores with category weights on a 0-100 scale. A deduction of (7 minus the lowest of Rules, Payouts, Costs and Trading Access) times 4 is subtracted if that lowest is below 7. The final score is the weighted total minus the deduction, floored at zero and rounded to one decimal place.
Each review shows the five category scores, their weights and the calculation that produces the overall score. While the audit continues firm by firm, most firms' category scores are still carried over from the previous reviews; firms re-audited against this methodology show the audit date in their review's score box; each review explains its category scores in the section verdicts, with sources for the facts, and does not list component scores one by one. The weights, the score guide and the formula are published on this page. No firm pays to change a score. The methodology is written by Noam Korbl, co-founder and COO, who leads Best Prop Firms research and tests the challenges, and fact-checked by Justin Grossbard, co-founder and CEO.
Interim scores
Most firms' category scores are still carried over from the version 1.0 reviews and mapped: Challenges became Rules, Fees became Costs, Markets and Platforms were averaged into Trading Access, and Support is no longer scored. Firms whose scores have been audited again against this methodology show the audit date in their review's score box. The audit continues firm by firm.
What a component score means
The 0 to 10 scale has four bands: 9 to 10 Best in market, 7 to 8 Market standard, 4 to 6 Below standard, and 0 to 3 Poor. A score of 7 is the market standard.
| Score | Meaning |
|---|---|
| 9 to 10 | Best in market. Among the most trader-friendly terms we record for this component |
| 7 to 8 | Market standard. In line with what most firms we review offer |
| 4 to 6 | Below standard. A noticeable drawback compared with most firms |
| 0 to 3 | Poor. A serious drawback, or a protection traders expect is missing |
The section that follows presents the category weightings for CFD and futures firms.
Category Weights for CFD and Futures Prop Firms
BestPropFirms.com applies separate weight sets for CFD and futures prop firms. The sets differ most in the Costs category, where CFD firms receive 20% and futures firms 30%. All other categories differ by 5 percentage points: Trust 10% for CFD and 15% for futures, Rules 30% versus 25%, Payouts 30% versus 25%, and Trading Access 10% versus 5%.
| Category | CFD prop firms Futures prop firms |
|---|---|
| Trust 6 factors, weighed together | CFD Futures |
| Rules 13 components (CFD), 11 (futures) | CFD Futures |
| Payouts 7 components (CFD), 10 (futures) | CFD Futures |
| Costs 5 components | CFD Futures |
| Trading Access 5 components | CFD Futures |
| Total | CFD100% ·Futures100% |
A weight is the maximum number of points out of 100 that a category contributes to the overall score. For example, a CFD firm scoring 8 out of 10 in Rules earns 24 of the 30 points available for that category, because the weight is 30 percent.
There is a deduction for a weak category, explained below. The final score is therefore not always just the weighted total.
The Trust category covers public reputation, backing and ownership, legal entity disclosure and verification, incident history and status, Trustpilot profile integrity and status, and time operating and payout track record.
Trust Score (10% CFD, 15% Futures)
Trust measures a firm's public standing, ownership backing, legal transparency, incident record, Trustpilot profile integrity and time operating. The category is a judgement across those six factors weighed together.
The factors are: public reputation, backing and ownership, legal entity disclosure and verification, incident history and status, Trustpilot profile integrity and status, and time operating and payout track record. A strength in one factor offsets a weakness in another.
Trust is calculated once at firm level and is not split by programme family. Where Trustpilot does not display a TrustScore for a firm, the review shows no score and uses neutral wording. This category applies the same six factors to CFD and futures firms.
Trust: what we weigh (same for both models)
| Component and what it records | How it usually counts |
|---|---|
| Public reputation: Trustpilot rating and review volume Records the firm's Trustpilot rating, read alongside the number of reviews it has received. | Major factor |
| Backing and ownership Records whether an established broker, trading firm or prop group owns or backs the firm. | Major factor |
| Legal entity disclosure and verification Records whether the firm discloses its legal entity clearly and makes it verifiable. | Major factor |
| Incident history/status Records the firm's public incident history and its current status on public records. | Major when serious |
| Trustpilot profile integrity/status Records whether reviews belong to the firm itself, a related broker or an unrelated profile, and any flags or suppression by Trustpilot. | Supporting factor |
| Time operating and payout track record Records how long the firm has been active in the prop firm industry and its record of paying traders. | Supporting factor |
| Total | Weighed together |
Profile integrity considers whether the reviews belong to the firm itself, a related broker or an unrelated profile, and whether Trustpilot has flagged or suppressed the profile.
How we score each Trust component
We weigh the firm's public record and published terms to judge Trust across its six factors. A Trustpilot rating built on few reviews counts for less. Backing by an established broker, trading firm or prop group counts in the firm's favour. A registration number confirmed on a public register counts in the firm's favour. No contracting entity counts against it. A current payout suspension, paused operations or open regulatory action counts heavily against the firm. A Trustpilot fake-review warning counts against the firm, weighed against the other factors. Eight years or more of operating history counts in the firm's favour.
| Component and what we assess | How terms usually score (out of 10) |
|---|---|
| Public reputation: Trustpilot rating and review volume The Trustpilot rating, read alongside the number of reviews. With no TrustScore shown, the visible star distribution is used |
|
| Backing and ownership Whether an established broker, trading firm or prop group owns or backs the firm |
|
| Legal entity disclosure and verification The contracting entity named in the firm's terms and whether a public register confirms it |
|
| Incident history/status Payout, operational or regulatory incidents on the public record and their current status |
|
| Trustpilot profile integrity/status Who the reviews belong to and any Trustpilot action on the profile |
|
| Time operating and payout track record Years since the firm launched its programmes, and its record of paying traders |
|
The Rules category covers evaluation difficulty, drawdown type and trading permissions.
Rules Score (30% CFD, 25% Futures)
The Rules category measures the difficulty of a firm's evaluation and the room a trader has to manage risk. A larger drawdown allowance gives a trader more room before an account is breached. Drawdown type matters because the way the floor moves affects risk management. A static drawdown floor stays fixed. A trailing drawdown floor moves up as the account makes profit, and the distinction between an end-of-day and an intraday trailing drawdown is captured. The static and trailing drawdown page explains these two drawdown types. The trailing drawdown page shows how a trailing floor moves, with a drawdown simulator. The end-of-day type updates on the closing balance, while the intraday type moves with open profit during the day.
An evaluation consistency rule limits how much of the total profit comes from a single day, which affects a trader whose results are uneven. A daily loss limit sets a separate cap on losses within one trading day. Minimum evaluation trading days, evaluation time limit, funding route and number of evaluation stages shape the pace and structure of the challenge.
Trading permissions cover EAs and automated trading, news trading, weekend holding, copy trading and hedging. Each permission affects which strategies a trader uses in a programme. The analyst scores each permission from fully allowed to not allowed, with partial permissions in between. The score guide reference points below set 10 as fully allowed, 7 as allowed with minor limits, 4 as limited, whether the limit is approval, an add-on, some accounts or a restriction, and 0 as not allowed.
Rules components and weights
| Component and what it records | CFD | Futures |
|---|---|---|
| Maximum drawdown allowance Records the maximum total loss an account incurs before being breached, irrespective of the drawdown type. | 18% | 19% |
| Drawdown type: static, trailing, etc. Records the type of drawdown, such as static or trailing, and whether trailing updates end-of-day or intraday. | 12% | 19% |
| Profit target relative to drawdown Records the required profit target expressed as a proportion of the drawdown allowance. | 12% | 14.25% |
| Funding route/number of evaluation stages Records the funding route and the number of evaluation stages a trader passes. | 8% | 7.6% |
| Daily loss allowance Records the maximum loss allowed in a single trading day before the account is breached or paused for that day. | 8% | 7.6% |
| Minimum evaluation trading days Records the minimum number of trading days required to complete the evaluation. | 5% | 4.75% |
| Evaluation time limit Records the maximum time allowed to meet the evaluation profit target. | 5% | Not scored |
| Evaluation consistency rule Records any rule limiting the percentage of total evaluation profit that comes from a single day. | 12% | 11.4% |
| EAs/automated trading Records whether expert advisors and fully automated trading strategies are permitted. | 5% | 5% |
| News trading permission Records whether, and under what restrictions, trading around high-impact news events is permitted. | 5% | 6.65% |
| Weekend holding permission Records whether traders are allowed to hold positions open over the weekend. | 3% | 2.85% |
| Copy trading permission Records whether copy trading of signals from other accounts is permitted. | 4% | 1.9% |
| Hedging permission Records whether hedging by holding opposite positions in the same instrument is permitted. | 3% | Not scored |
| Total | 100% | 100% |
These measure how much room traders have to trade and how difficult the evaluation is. For example, the target-to-drawdown component compares the required profit with the amount the trader loses.
How we score each Rules component
We weigh the firm's published terms and our own account records to score Rules. Drawdown allowance is a percentage of the starting balance. For CFD, the market standard is 10%. For futures, it is 4%. A static floor counts as the most forgiving drawdown type. A floor that trails intraday equity with no stop counts as the least forgiving. We compare the profit target with the drawdown. We weigh permissions such as EAs, news trading, weekend holding, copy trading and hedging from fully allowed to not allowed, with partial permissions in between. A rule that applies to only some accounts in a programme family counts below a rule that applies to all of them.
| Component and what we assess | How terms usually score (out of 10) |
|---|---|
| Maximum drawdown allowance Maximum loss as a percentage of the starting balance | CFD
Futures
|
| Drawdown type: static, trailing, etc. How the loss floor moves as the account grows |
|
| Profit target relative to drawdown First-stage profit target divided by the maximum drawdown | CFD
Futures
|
| Funding route/number of evaluation stages Evaluation stages before a funded account | CFD
Futures
|
| Daily loss allowance Daily loss limit as a percentage of the starting balance, and whether it breaches or only pauses the account | CFD
Futures
|
| Minimum evaluation trading days Minimum trading days per evaluation stage |
|
| Evaluation time limit Calendar days allowed to pass each stage | CFD
|
| Evaluation consistency rule Largest share of evaluation profit allowed from one day |
|
| EAs/automated trading Whether expert advisors and automated strategies are allowed |
|
| News trading permission Whether trading around high-impact news is allowed |
|
| Weekend holding permission Whether positions are allowed over the weekend |
|
| Copy trading permission Whether copying trades between accounts is allowed |
|
| Hedging permission Whether opposite positions are allowed in one account | CFD
|
Rules in practice: verified programmes
The table below shows recorded Rules inputs for the programmes verified on 3 October 2026. Each value is the raw figure taken from the firm's published terms, not a component score.
| Programme | Profit target | Drawdown | Drawdown type | Target ÷ drawdown (calculated) | Daily loss limit | Consistency rule | Minimum days |
|---|---|---|---|---|---|---|---|
| Topstep Trading Combine Standard pricing / XFA Standard / no DLL add-on | $3,000.00 | $2,000.00 | End-of-day trailing | 1.50 | Not applicable | 55% | 2 |
| Apex Trader Funding EOD Evaluation No Activation Fee / PA / Rithmic | $3,000.00 | $2,000.00 | End-of-day trailing | 1.50 | $1,000.00 | Not applicable | No minimum |
| Apex Trader Funding Intraday Evaluation No Activation Fee / PA / Rithmic | $3,000.00 | $2,000.00 | Intraday trailing | 1.50 | Not applicable | Not applicable | No minimum |
| MyFundedFutures Builder Default / 2000 MLL / current one-time purchase | $3,000.00 | $2,000.00 | End-of-day trailing | 1.50 | $1,000.00 | Not applicable | 1 |
| MyFundedFutures Rapid Intraday / current one-time purchase | $3,000.00 | $2,000.00 | End-of-day trailing | 1.50 | Not applicable | 50% | 2 |
| Tradeify Select Evaluation 40% / Select Flex / new purchase after 1 Sep 2026 | $3,000.00 | $2,000.00 | End-of-day trailing | 1.50 | Not applicable | 40% | 3 |
| Programme | Profit targets | Maximum loss | Loss type | Phase 1 target ÷ max loss (calculated) | Daily loss | Minimum days |
|---|---|---|---|---|---|---|
| FTMO FTMO Global Challenge: 2-Step, Standard CFD | 10% / 5% | 10% | Static | 1.00 | 5% | 4 per phase |
| FundedNext FundedNext Stellar 2-Step CFD, current purchase path | 8% / 5% | 10% | Static | 0.80 | 5% | 5 per phase |
The official source for each futures field is listed in the programme comparison.
The Payouts category covers profit splits, payout timing and withdrawal conditions.
Payouts Score (30% CFD, 25% Futures)
The Payouts category measures how a firm structures profit withdrawals and the conditions a trader meets before requesting a payout. The default profit split carries the largest weight for CFD firms, while for futures firms the required winning or qualifying days carries the most weight. Time to first payout and time between payouts measure how long a trader waits for the first withdrawal and for subsequent withdrawals. A shorter wait reduces the time before a trader accesses profits.
A funded or payout consistency rule limits how much of a payout-eligible profit comes from a single day, similar to an evaluation consistency rule. The minimum withdrawal amount sets the smallest sum a trader requests. For futures firms, a payout buffer requires the account to hold an amount above its starting level before profit is withdrawn. A per-payout cap limits how much is withdrawn in one request, and a lifetime payout cap sets an upper limit on total withdrawals.
Qualifying days are trading days that meet a minimum profit before a payout request. The components include the default and maximum profit split, time to first payout, and payout frequency. The how prop firms pay you page explains the stages a payout passes through, from the request to the money arriving.
Payouts components and weights
| Component and what it records | CFD | Futures |
|---|---|---|
| Default profit split Records the default percentage of profits the trader receives upon a payout. | 30% | 12.5% |
| Maximum profit split Records the highest profit split percentage a trader achieves. | 5% | 2.5% |
| Time to first payout Records how long a trader waits on a funded account before the first payout is requested. | 20% | 10% |
| Time between payouts Records the minimum waiting period between consecutive payout requests. | 15% | 7.5% |
| Minimum withdrawal amount Records the smallest amount a trader requests when making a withdrawal. | 10% | 5% |
| Required winning/qualifying days Records the number of trading days that meet a minimum profit before a payout request. | 5% | 20% |
| Funded/payout consistency rule Records any consistency rule applied to funded accounts that limits single-day profit concentration for payouts. | 15% | 15% |
| Required payout buffer Records the amount the funded account holds above its starting level before a profit withdrawal. | Not scored | 12.5% |
| Per-payout withdrawal cap Records the maximum amount that is withdrawn in a single payout request. | Not scored | 12.5% |
| Lifetime payout cap Records the maximum total profit a trader withdraws over the lifetime of the account. | Not scored | 2.5% |
| Total | 100% | 100% |
Futures puts more weight on whether traders actually access their profits: qualifying days, buffers and withdrawal limits.
How we score each Payouts component
We weigh the firm's published payout terms to score Payouts. The default split is the share with no add-on. For CFD, 80% is the market standard. For futures, 90% is the market standard. The maximum split includes add-ons and scaling. Time to first payout runs from the start of the funded account to the first possible request. Fourteen days is the market standard, and on-demand payouts score highest for time to first payout. For futures, we judge the payout buffer and per-payout cap as a percentage of the starting balance. A lifetime cap with a stated route to continue ranks above a hard cap.
| Component and what we assess | How terms usually score (out of 10) |
|---|---|
| Default profit split Trader share with no add-on or condition | CFD
Futures
|
| Maximum profit split Highest trader share available, including add-ons and scaling |
|
| Time to first payout Calendar days from the funded account starting to the first possible payout request |
|
| Time between payouts Calendar days between payout requests |
|
| Minimum withdrawal amount Smallest payout request, in USD | CFD
Futures
|
| Required winning/qualifying days Qualifying days required per payout |
|
| Funded/payout consistency rule Largest share of payout-period profit allowed from one day |
|
| Required payout buffer Balance required above the starting level before a payout, as a percentage of the starting balance | Futures
|
| Per-payout withdrawal cap Largest single payout, as a percentage of the starting balance | Futures
|
| Lifetime payout cap Any limit on total payouts from one account | Futures
|
Payouts in practice: verified programmes
The table below shows recorded Payouts inputs for the same programmes verified on 3 October 2026. The values are recorded from the firms' published terms and are not component scores.
| Programme | Trader share | Qualifying days | Minimum payout | Maximum per request | Payout buffer | Consistency rule |
|---|---|---|---|---|---|---|
| Topstep Trading Combine Standard pricing / XFA Standard / no DLL add-on | 90% | 5 days of $150.00+ | $125.00 | $2,000.00 | Not applicable | Not applicable |
| Apex Trader Funding EOD Evaluation No Activation Fee / PA / Rithmic | 100% | 5 days of $250.00+ | $500.00 | $1,500.00 | $2,100.00 | 50% |
| Apex Trader Funding Intraday Evaluation No Activation Fee / PA / Rithmic | 100% | 5 days of $200.00+ | $500.00 | $1,500.00 | $2,100.00 | 50% |
| MyFundedFutures Builder Default / 2000 MLL / current one-time purchase | 80% | Not applicable | $500.00 | $2,000.00 | $2,100.00 | 50% |
| MyFundedFutures Rapid Intraday / current one-time purchase | 90% | Not applicable | $500.00 | Not verified | $2,100.00 | Not applicable |
| Tradeify Select Evaluation 40% / Select Flex / new purchase after 1 Sep 2026 | 90% | 5 days of $150.00+ | $250.00 | $2,500.00 | Not applicable | Not applicable |
| Programme | Reward share | First payout request |
|---|---|---|
| FTMO FTMO Global Challenge: 2-Step, Standard CFD | 80% standard, 90% conditional | From day 14 |
| FundedNext FundedNext Stellar 2-Step CFD, current purchase path | 80% standard, 60% three profitable days, 90% on-demand (option chosen at purchase) | 21-day first cycle on the standard option |
The Costs category details evaluation fees, monthly funded-account fees and additional charges.
Costs Score (20% CFD, 30% Futures)
The Costs category measures the fees a trader pays to enter an evaluation, to reset a failed attempt and to trade. For CFD firms, the absolute entry fee in USD is the largest component. The entry fee relative to account size expresses the cost as a proportion of the account the trader is trying to access. Forex spreads are measured because wider spreads increase the trading cost on every position. The reset fee relative to entry fee shows how much a second attempt costs compared to the first. The fee refund policy records whether and how the entry fee is returned.
For futures firms, the minimum cost to first payout is the dominant component. Some futures evaluations are billed monthly until passed, while others are a one-off purchase. An activation fee is charged when a trader passes and moves to a funded account.
One-off versus recurring evaluation billing, monthly funded-account fees and additional data and platform fees are scored for futures firms only. These components capture the total cost a trader faces from sign-up through to a first payout. A blank field means the firm has not published that figure, or the price appears only inside a checkout we cannot read. The component is excluded from the weighted average. The how prop firms make money page explains the business model behind these costs.
Costs components and weights
| Component and what it records | CFD | Futures |
|---|---|---|
| Absolute entry fee in USD Records the entry fee converted to US dollars for comparison. | 35% | Not scored |
| Entry fee relative to account size Records the entry fee as a percentage of the account size it buys. | 20% | Not scored |
| Forex spreads Records the typical forex spread costs faced by traders on the platform. | 25% | Not scored |
| Reset fee relative to entry fee Records the reset fee expressed as a percentage of the original entry fee. | 10% | 5% |
| Fee refund policy Records whether the entry fee is refundable and the conditions under which a refund applies. | 10% | Not scored |
| Minimum cost to first payout Records the cost from evaluation entry to first payout, including evaluation, activation, data, funded account and platform fees, with recurring charges estimated from the time to first payout. | Not scored | 65% |
| One-off versus recurring evaluation billing Records whether the evaluation fee is a one-off payment or billed monthly until the trader passes. | Not scored | 15% |
| Monthly funded-account fees Records any recurring monthly fees charged on the funded account. | Not scored | 10% |
| Additional data and platform fees Records any extra charges for data feeds or platform access. | Not scored | 5% |
| Total | 100% | 100% |
For CFDs, only the absolute entry-fee component uses USD conversion. The entry-fee/account-size and reset-fee/entry-fee ratios retain the original currency.
For futures, minimum cost to first payout adds the evaluation fee, activation fee and applicable data, funded-account and platform charges. Recurring charges use the first-payout timing to estimate the required monthly periods.
How we score each Costs component
We weigh Cost components against the published reference points below. For CFD programmes, the cheapest full evaluation has a market standard of about 60 USD, and the fee at the 100,000 USD account has a market standard of about 0.55%. Spreads count only when the firm publishes a typical EUR/USD figure for spread plus commission. When a firm publishes none, we leave spreads out of the Costs score rather than guess them. We judge a programme with no reset like a reset at the full entry fee. A full refund with the first payout usually scores 10. For futures programmes, the minimum cost to first payout adds evaluation, activation, data, funded-account and platform charges. About 175 USD is the market standard. One-off billing ranks above monthly billing.
| Component and what we assess | How terms usually score (out of 10) |
|---|---|
| Absolute entry fee in USD Cheapest full evaluation in the programme family, in USD | CFD
|
| Entry fee relative to account size Fee as a percentage of the reference account size | CFD
|
| Forex spreads Typical EUR/USD cost in pips, spread plus commission, as published | CFD
|
| Reset fee relative to entry fee Reset fee compared with the entry fee |
|
| Fee refund policy Whether and when the entry fee is returned | CFD
|
| Minimum cost to first payout Evaluation, activation, data, funded-account and platform charges to the first payout, in USD | Futures
|
| One-off versus recurring evaluation billing How the evaluation is billed | Futures
|
| Monthly funded-account fees Recurring fee on the funded account, per month | Futures
|
| Additional data and platform fees Required data or platform charges, per month | Futures
|
Costs in practice: verified programmes
The table below shows recorded futures Costs inputs for the futures programmes verified on 3 October 2026. It lists the evaluation price, billing model, activation fee, reset fee and funded monthly fee as published by each firm.
| Programme | Evaluation price | Billing | Activation fee | Reset fee | Funded monthly fee |
|---|---|---|---|---|---|
| Topstep Trading Combine Standard pricing / XFA Standard / no DLL add-on | $49.00 | Monthly | $149.00 | $49.00 | $0.00 |
| Apex Trader Funding EOD Evaluation No Activation Fee / PA / Rithmic | Not verified | One-time, 30-day evaluation access | $0.00 | Not applicable | $0.00 |
| Apex Trader Funding Intraday Evaluation No Activation Fee / PA / Rithmic | Not verified | One-time, 30-day evaluation access | $0.00 | Not applicable | $0.00 |
| MyFundedFutures Builder Default / 2000 MLL / current one-time purchase | $153.00 | One-time | $0.00 | Not verified | $0.00 |
| MyFundedFutures Rapid Intraday / current one-time purchase | $209.00 | One-time | $0.00 | Not verified | $0.00 |
| Tradeify Select Evaluation 40% / Select Flex / new purchase after 1 Sep 2026 | $165.00 | One-time | $0.00 | $109.00 | $0.00 |
The Trading Access category measures tradable instruments, leverage and regional availability.
Trading Access Score (10% CFD, 5% Futures)
The Trading Access category measures the range of platforms, instruments and markets a trader uses, plus geographic availability. Platform choice is scored by the number of distinct platforms offered. For CFD firms, one platform scores 5, two score 7, three score 9 and four or more score 10. A wider platform choice lets a trader use familiar tools.
Number of tradable instruments and number of asset classes measure the breadth of the market access. Leverage is recorded for CFD firms. Regional availability checks which countries are eligible. A trader in a restricted region finds fewer firms available, and this component reflects that. The US prop firm eligibility guide compares documented US eligibility, platform restrictions and payout access for selected forex and futures prop services.
For futures firms, number of permitted accounts, route to live funding and scaling opportunities replace the instrument and asset-class components. The scaling opportunities component measures the ability to grow account size or contract limits over time, as explained on the scaling plans page.
Trading Access components and weights
| Component and what it records | CFD | Futures |
|---|---|---|
| Platform choice Records the number of distinct trading platforms the firm offers to its traders. | 25% | 30% |
| Number of tradable instruments Records the total count of instruments available for trading across all markets. | 25% | Not scored |
| Number of asset classes Records the number of distinct asset classes, such as forex, indices, commodities and crypto. | 20% | Not scored |
| Leverage Records the maximum leverage ratio available to traders on the firm's accounts. | 15% | Not scored |
| Regional availability Records the countries or regions from which the firm accepts traders. | 15% | 10% |
| Number of permitted accounts Records the maximum number of funded accounts a trader holds at the same time. | Not scored | 25% |
| Route to live funding Records whether the firm provides a path to live funded trading beyond simulated accounts. | Not scored | 20% |
| Scaling opportunities Records the availability and terms of scaling plans that increase account size over time. | Not scored | 15% |
| Total | 100% | 100% |
How we score each Trading Access component
We weigh the firm's platform list, leverage settings and regional exclusions to score Trading Access. For CFD platform choice, one platform usually scores around 5, two around 7, three around 9, and four or more 10. For futures platform choice, two or three platforms is the market standard. Leverage of 1:50 to 1:100 scores highest. Regional availability is judged by how many countries a firm excludes. About 25 is the market standard. The analyst records the number of excluded countries from the firm's terms. For futures, a stated route to live funding and a published scaling plan score highest.
| Component and what we assess | How terms usually score (out of 10) |
|---|---|
| Platform choice Number of supported trading platforms | CFD
Futures
|
| Number of tradable instruments Instruments available to trade | CFD
|
| Number of asset classes Forex, indices, metals, energies, crypto, stocks and similar groups | CFD
|
| Leverage Maximum forex leverage | CFD
|
| Regional availability Number of countries the firm excludes |
|
| Number of permitted accounts Funded accounts one trader is allowed to hold at once | Futures
|
| Route to live funding Whether a path from simulated to live funding is stated | Futures
|
| Scaling opportunities Whether account size or contract limits grow over time | Futures
|
The final score is calculated from weighted category scores and a weak-category deduction.
How the Final Score Is Calculated
The calculation moves from component scores to category scores, then to a weighted total, a weak-category deduction, and finally the overall score rounded to one decimal place.
The calculation, step by step
-
Step 1: Analysts score each component out of 10, guided by the score guide.
Analysts score each component out of 10 after researching the firm's published terms, the public record and our own account records. The score guide shows examples of how terms usually score at 10, 7, 4 and 1. For example, one CFD platform usually scores around 5, two around 7, three around 9, and four or more 10. The analyst weighs the whole picture. After this step, the weighting is fixed arithmetic.
-
Step 2: For Rules, Payouts, Costs and Trading Access, the category is a weighted average of its component scores. Trust is the exception.
Category score = Σ(component score × weight) ÷ Σ(available weights)
At least 70% of the component weight has usable scores. Otherwise, that category remains blank. Separate completeness checks still prevent an overall score. Trust is the exception, judged across its six factors without fixed weights.
-
Step 3: Programme-family scores are averaged equally within each firm.
Trust is calculated at firm level. Each eligible family has the relevant category score before the firm-level category is produced. Fixed-odds session programmes are excluded.
-
Step 4: A weak programme caps Rules or Payouts.
A score of 3/10 or below in Rules or Payouts for any eligible family caps the corresponding firm-level category at 6/10.
-
Step 5: A further weak-category penalty applies to the overall score:
Lowest category = MIN(Rules, Payouts, Costs, Access)
Deduction = MAX(0, 7 − Lowest category) × 4
Final score = MAX(0, Weighted total − Deduction)
For example, a lowest category of 5.5/10 deducts 6 points. Trust is not included in this particular penalty. The final score is rounded to one decimal place.
| Lowest of Rules, Payouts, Costs, Access | Points deducted |
|---|---|
| 7.0 or higher | 0.0 |
| 6.5/10 | 2.0 |
| 6.0/10 | 4.0 |
| 5.5/10 | 6.0 |
| 5.0/10 | 8.0 |
| 4.0/10 | 12.0 |
| 3.0/10 | 16.0 |
The scoring considerations below list the conventions every analyst follows when scoring a component.
Scoring Considerations
The table below lists the conventions every analyst follows when scoring any component across all categories. These conventions cover percentages, missing values, default terms and account types.
| Consideration | Rule |
|---|---|
| Who sets the score | The analyst reviewing the firm scores each component out of 10 from the firm's published terms, the public record and our own account records, using the reference points for that component. |
| Reference points, not a lookup | The reference points are examples of what a 10, a 7, a 4 and a 1 usually look like. Terms between two points score between them. Conditions the examples do not cover, and the overall balance of a firm's terms, are weighed in the analyst's judgement. |
| Examples guide, verdicts explain | The score guide presents examples of typical term scores, and the analyst reviews each firm's complete terms. Departures from these examples receive an explanation in the category verdict. |
| 7 is the market standard | A 7 means the terms match what most firms we review offer. A category below 7 is below market standard, which is where the weak-category deduction starts. |
| Reference account size | Percentages and USD amounts are judged on the 100,000 USD account for CFD programmes and the 50,000 USD account for futures programmes, or the nearest size offered. The absolute entry fee uses the cheapest full evaluation. |
| Conditional terms | Default terms set the default components. Terms that need an add-on, a payout option or a scaling level count only toward the maximum or scaling components. |
| Rules on some accounts only | A rule that applies to only some accounts in a programme family scores below a rule that applies to all of them, and the review names the accounts affected. |
| Separate reviews by market | Our aim is a separate review for each market when a firm sells both CFD and futures programmes, with futures programmes scored on the futures weights. A combined review remains scored on the CFD weights until the firm's separate futures review is published. |
| Missing values | An unpublished or unreadable value is left blank and removed from the category average, never scored as zero. |
| Instant and direct funding | Evaluation-only components (target, time limit, minimum days and evaluation consistency) are not applicable and are removed from the average. |
| No TrustScore shown | The public reputation factor uses the visible star distribution recorded at capture. The profile integrity factor records the missing TrustScore. |
| Scores explained on each review | Each review shows the five category scores with their weights and the calculation. Each category score is explained in its section verdicts, with the sources for the facts behind it. |
A worked example applies the methodology to a hypothetical firm.
Worked Example: From Component Scores to a Final Score
Step one: component scores to a category score
The table below shows a component-level example for a hypothetical CFD firm. Seven Payouts components with scores 7, 7, 7, 7, 10, 10 and 4 and weights 30, 5, 20, 15, 10, 5 and 15 combine to a Payouts score of 7.0.
| Payouts component | What the analyst found | Score | CFD weight | Points |
|---|---|---|---|---|
| Default profit split | 80% with no add-on | 7/10 | 30% | 2.10 |
| Maximum profit split | 90% with a paid add-on | 7/10 | 5% | 0.35 |
| Time to first payout | 14 days | 7/10 | 20% | 1.40 |
| Time between payouts | Every 14 days | 7/10 | 15% | 1.05 |
| Minimum withdrawal amount | 50 USD | 10/10 | 10% | 1.00 |
| Required winning/qualifying days | None | 10/10 | 5% | 0.50 |
| Funded/payout consistency rule | Best day capped at 40% of payout profit | 4/10 | 15% | 0.60 |
| Payouts score | 7.0/10 | |||
Step two: category scores to the final score
The table that follows uses the Payouts score of 7.0 and the other category scores for the same hypothetical firm. The final score is shown under the CFD weights (65.0) and the futures weights (61.5).
| Category | Score | CFD weight | CFD points | Futures weight | Futures points |
|---|---|---|---|---|---|
| Trust | 6.0/10 | 10% | 6.0 | 15% | 9.0 |
| Rules | 8.0/10 | 30% | 24.0 | 25% | 20.0 |
| Payouts | 7.0/10 | 30% | 21.0 | 25% | 17.5 |
| Costs | 5.5/10 | 20% | 11.0 | 30% | 16.5 |
| Trading Access | 9.0/10 | 10% | 9.0 | 5% | 4.5 |
| Weighted total | 71.0 | 67.5 | |||
| Deduction (lowest: Costs at 5.5) | -6.0 | -6.0 | |||
| Final score | 65.0 (Mixed) | 61.5 (Poor) | |||
Rating labels map final score ranges to descriptive ratings.
Rating Labels
The table below shows the label each firm receives based on its overall score.
| Overall score | Label shown on the review |
|---|---|
| 88.0 to 100 | Excellent |
| 82.0 to 87.9 | Great |
| 76.0 to 81.9 | Good |
| 70.0 to 75.9 | Fair |
| 62.0 to 69.9 | Mixed |
| Below 62.0 | Poor |
The data section describes how firm data is gathered, recorded and verified.
How We Collect and Verify Data
Every value we score comes from a prop firm's own published terms, rules, help-centre pages, product pages and pricing pages, except for Trust data, which is drawn from Trustpilot and the public record. We do not estimate a figure that a firm has not made public. A price that appears only inside a checkout we cannot read is left blank rather than guessed. A blank is never treated as zero in the scoring.
Some firms embed their pricing as structured data in their own web pages. We read that embedded pricing data directly. This reduces transcription error and captures the exact figures a firm displays to a visitor.
Every firm record carries a last-verified date so a reader knows how fresh the data is. When only part of a record is re-checked, the last-verified date is updated only if the review names the parts that were checked. Selected programmes have programme-level records in which every field names its official source and its verification date. Six futures 50,000 USD programmes and two CFD two-step programmes were verified this way on 3 October 2026.
Every change to a firm record is logged with its date, the fields changed, the reason and the source. A new firm receives a full check of its published terms before its review is published. Trustpilot ratings and review counts are captured with a dated screenshot, and the capture date is shown with the screenshot. Figures a firm publishes about itself, such as its own total of rewards paid, are recorded as firm-reported and are not treated as independent evidence.
Corrections
When a firm or a reader reports a change, it is checked against the firm's own published terms before the record is updated. A claim that is not confirmed from the firm's own published terms is not applied. Corrections are sent through the contact page.
The evidence register below records the dated challenges the team bought, with screenshots on each firm's review.
Evidence Register
The evidence register is a dated set of account records with screenshots. Each record appears on that firm's review. The register currently lists four challenges bought by the team. The FundedNext record covers a Stellar 1-Step 25,000 USD challenge bought, with 10 trades placed and screenshots from October 2026. The BrightFunded record covers a 2-Step Original 25,000 USD challenge bought, started 13 April 2026, traded on 35 days and later breached. The FXIFY and Blueberry Funded records cover challenges bought but not traded. No payout record is listed yet, so no review claims a received payout.
| Firm | Record | Date | Reference |
|---|---|---|---|
| FundedNext | Challenge bought: Stellar 1-Step, 25,000 USD. 10 trades placed. | October 2026 (screenshots) | Account ending 5887 |
| BrightFunded | Challenge bought: 2-Step Original, 25,000 USD. Traded on 35 days, later breached. | Started 13 April 2026 | Account ending 3500 |
| FXIFY | Challenge bought: One Step, 25,000 USD. Not traded; failed under the 60-day inactivity rule. | Failed 12 June 2026 | Account ending 3450 |
| Blueberry Funded | Challenge bought: 1-Step, 25,000 USD. Not traded; marked breached. | Started 9 May 2026 | Account ending 7291 |
The next section explains what the score does not measure: pass rates, likely earnings and whether a particular trader is paid.
What the Score Does Not Measure
The score does not measure pass rates, a trader's likely earnings, or whether a particular trader is paid. It assesses the published terms and public record at the last verification date. Terms change between checks, and a score reflects the information available at that point.
Trustpilot data comes from a third party and is subject to withdrawal or suppression by Trustpilot at any time. The score is general information about prop firms, not personal financial advice. A trader reads a firm's current terms before purchasing an evaluation.
A high score does not guarantee a positive experience. It indicates that a firm's published terms and public record scored well against the components described on this page. Traders consider their own strategy, risk tolerance and location before choosing a firm.
The scores are maintained by Noam Korbl, co-founder and COO. A second member of the editorial team checks each firm's scores before publication.
Who Maintains the Scores
The firm records and the scoring behind every ranking on BestPropFirms.com are maintained by Noam Korbl, co-founder and COO. The methodology is fact-checked by Justin Grossbard, co-founder and CEO. A second member of the editorial team checks each firm's category scores before they are published.
A reader who believes a recorded value is out of date reaches the team through the contact page.
Editorial independence explains that no firm pays to influence scores or rankings.
Editorial Independence
No prop firm pays for a better score or ranking on BestPropFirms.com. We apply the same methodology to every firm we review, regardless of any commercial relationship. The scoring record contains the same category checks for every firm, and the overall score is produced from those checks rather than from a negotiated position.
The site earns affiliate commission from some firms. That commission does not change the score, the weighting or the ranking order. A firm that pays us nothing is scored on the same terms as a firm that pays us, and we state that plainly because rankings are only useful if they cannot be bought.
Keeping Reviews Current
We update the site and reviews as firm terms change. Prop firms that stop operating, such as Fidelcrest and Vantage Elite Trader, are not listed in shortlists or educational materials. When a firm ceases operations or fundamentally changes its conditions, we update or remove its review from the rankings.
This principle of keeping old claims off the site matters for trust. Every record is dated, and changes to a firm’s dashboard or rules are reflected in the score rather than left to sit. Readers who spot data that needs updating contact us.
Version History
Methodology version 2.0 replaces version 1.0, which used seven categories (Challenges, Fees, Markets, Payouts, Platforms, Support and Trust) with weights described only in words. All scores were recalculated under the new model.
| Version | Published | Model |
|---|---|---|
| 2.0 | 27 October 2026 | Five categories (Trust, Rules, Payouts, Costs, Trading Access) with published CFD and futures weights, component weights, programme caps and a weak-category deduction. |
| 1.0 | 1 February 2026 | Seven categories (Challenges, Fees, Markets, Payouts, Platforms, Support, Trust) with weights described in words only. |
Frequently Asked Questions
What is a good prop firm score?
A score of 88 to 100 is labelled Excellent, 82 to 87.9 Great, 76 to 81.9 Good, 70 to 75.9 Fair, 62 to 69.9 Mixed, and below 62 Poor. These labels appear next to the overall score on a firm's review.
How do CFD and futures scores differ?
CFD and futures firms are scored with different weight sets. The CFD set weights Rules and Payouts at 30% each, Costs at 20%, Trust and Trading Access at 10% each. The futures set weights Costs at 30%, Rules and Payouts at 25% each, Trust at 15% and Trading Access at 5%. Additionally, the Costs and Trading Access categories use different components for each firm type.
Why is a firm's overall score sometimes lower than its weighted total?
A weak-category deduction reduces the weighted total when any of Rules, Payouts, Costs or Trading Access scores below 7 out of 10. The deduction equals (7 minus the lowest of those four category scores) multiplied by 4 points. For example, a lowest category score of 5.5 deducts 6 points from the weighted total.
What happens when a firm's data is incomplete?
A category with less than 70% of its component weight scored stays blank. Separate completeness checks prevent an overall score from being produced. A firm-level category is produced only when each eligible programme family has a score for that category.
How is Trust scored?
Trust is a judgement across six factors weighed together with no fixed internal weights. The factors are public reputation, backing and ownership, legal entity disclosure and verification, incident history and status, Trustpilot profile integrity and status, and time operating and payout track record. Public reputation, backing and ownership, and legal entity disclosure and verification are major factors. A firm owned or backed by an established broker or prop group, with a registered contracting company, earns credit even when its Trustpilot profile is thin, new or mixed.
Are component scores calculated by a formula or set by analysts?
Analysts set each component score after researching the firm's published terms, the public record and our own account records. The published score guide shows reference points for a 10, 7, 4 and 1. No formula calculates a component score. Analysts use judgement guided by those reference points. Each review explains its category scores in the section verdicts, with sources for the facts. A second member of the editorial team checks each firm's scores. The weights, the 70% rule, the programme family cap, the deduction and the rounding are fixed arithmetic applied identically to every firm.
Does a high score guarantee a payout?
A high score does not guarantee that a firm pays a particular trader. The score measures the firm's published terms and public record, not pass rates or individual payout outcomes. It does not predict whether any specific payout request is honoured.
Why did scores change in methodology version 2.0?
Version 2.0 moved from seven categories with weights described only in words to five categories with published numeric weights and a formula. Every firm's score was recalculated under the new model, so scores differ from those shown under version 1.0.
How often are prop firm scores updated?
Every firm record carries a last-verified date. We check a change against the firm's own published pages when a firm changes its terms or a reader reports a change. Each change is logged with its date, the fields changed, the reason and the source. A full re-check is performed before a new firm is published.
Are prop firms or individual programmes scored?
Each programme family is scored separately, and the firm-level category score is the equal average of the eligible families. Trust is calculated once at firm level. Both a one-step and a two-step evaluation contribute equally to the Rules, Payouts, Costs and Trading Access categories when a firm offers both.
Can a prop firm pay to improve its placement?
No prop firm pays to improve its placement. The site earns affiliate commission from some firms, but that commission does not change any score, weight or ranking. The scoring methodology is applied identically to every firm, and the overall score comes from the same category checks.
Related Pages
- All prop firm reviews : every scored firm, ranked.
- Forex prop firm rankings : scored with the CFD weights.
- Futures prop firm rankings : scored with the futures weights.
- Prop trading education : the rules behind the scores, explained.
- Verified discount codes : current offers on challenge fees.
- About BestPropFirms : who writes and checks this research.
About the Author

Co-founder and COO, leads Best Prop Firms research and tests the challenges
Noam maintains the firm records and scoring behind every ranking on this site. This methodology is fact-checked by Justin Grossbard.